
How to Backtest a Bitcoin Trading Strategy from Scratch: A Step-by-Step Guide
Backtesting lets you test trading ideas with past data. In this quick guide, we’ll backtest a 50/200-day Bitcoin SMA crossover strategy in Python, evaluating profits, drawdowns, and overall performance.
Introduction
Backtesting is a cornerstone of algorithmic and quantitative trading, allowing you to simulate how a trading strategy might have performed using historical market data. By thoroughly testing your ideas before risking real capital, you can identify potential weaknesses, refine your tactics, and gain the confidence needed to succeed in today’s complex financial markets.
In this guide, we’ll demonstrate a professional approach to backtesting a Bitcoin (BTC-USD) trading strategy without relying on specialized backtesting frameworks. We’ll implement a Moving Average Crossover strategy from scratch—perfect for traders, quantitative analysts, and algorithmic trading enthusiasts looking to develop robust, data-driven crypto trading strategies.
Why Backtesting Matters
Effective backtesting allows you to:
Validate Trading Ideas: Test if your strategy would have generated profitable signals in the past.
Enhance Risk Management: Understand potential drawdowns and volatile periods to refine your approach.
Improve Confidence: Gain trust in your strategy before committing real capital.
Streamline Optimization: Quickly iterate, adjust parameters, and incorporate new indicators.
Backtesting is essential for anyone serious about quantitative trading—especially in the dynamic crypto market, where data-driven insights can make a significant difference.
Table of Contents
Why Backtesting Matters
Prerequisites and Setup
Retrieving Historical Bitcoin Data
Implementing the Moving Average Crossover Strategy
Simulating Trades and Managing a Portfolio
Visualizing Strategy Performance
Evaluating Results and Key Metrics
Optimizing and Iterating Your Strategy
Conclusion and Next Steps
Prerequisites and Setup
Tools and Libraries:
Python 3.7+
pandas for data manipulation
yfinance for retrieving historical market data
matplotlib for data visualization
Install the required libraries:
Initial Capital and Assumptions:
Initial Capital: $10,000
Strategy: A simple SMA (50-period vs. 200-period) crossover
Market: Bitcoin (BTC-USD), daily timeframe
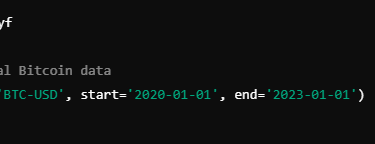
Retrieving Historical Bitcoin Data
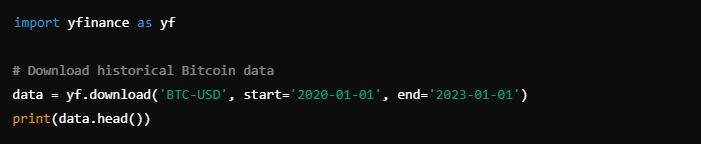
We’ll use yfinance to download historical Bitcoin prices from Yahoo Finance. For this example, we’ll analyze the period from January 1, 2020, to January 1, 2023.
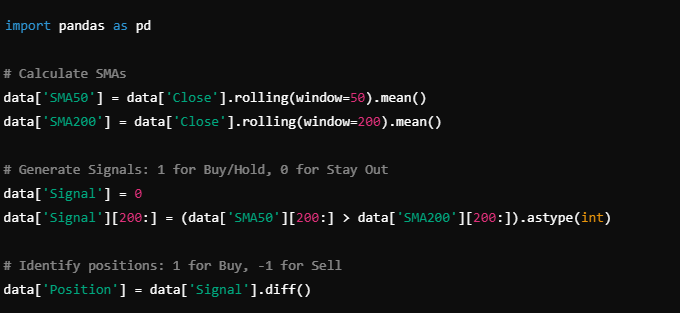
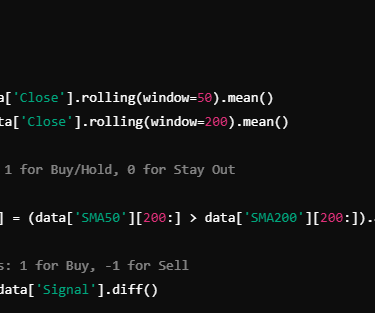
Implementing the Moving Average Crossover Strategy
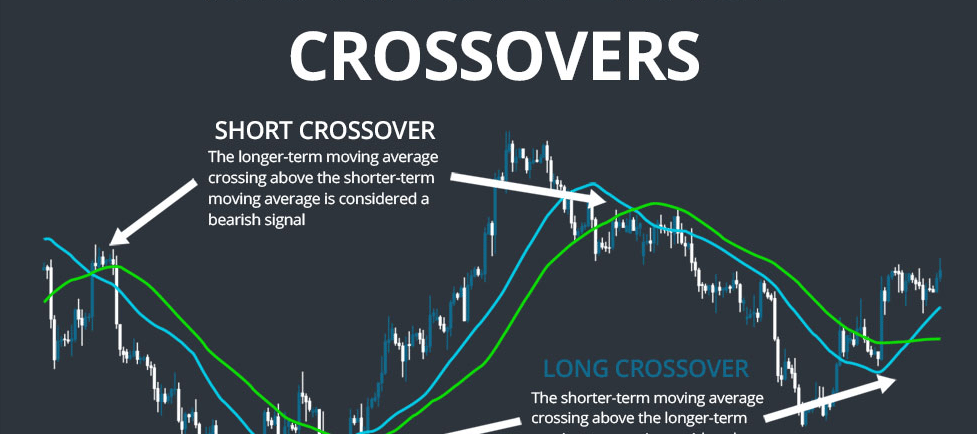
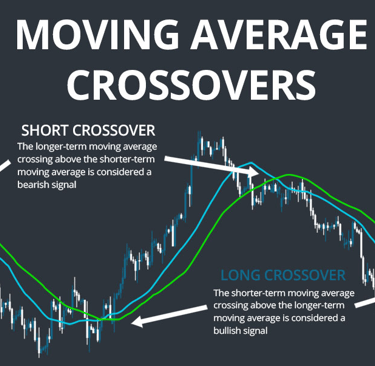
Our strategy uses two simple moving averages (SMAs) to generate signals:
Short-Term SMA (50-Period): Captures shorter-term price trends.
Long-Term SMA (200-Period): Filters out short-term market noise.
Trading Signals:
Buy: When the 50-day SMA crosses above the 200-day SMA.
Sell: When the 50-day SMA crosses below the 200-day SMA
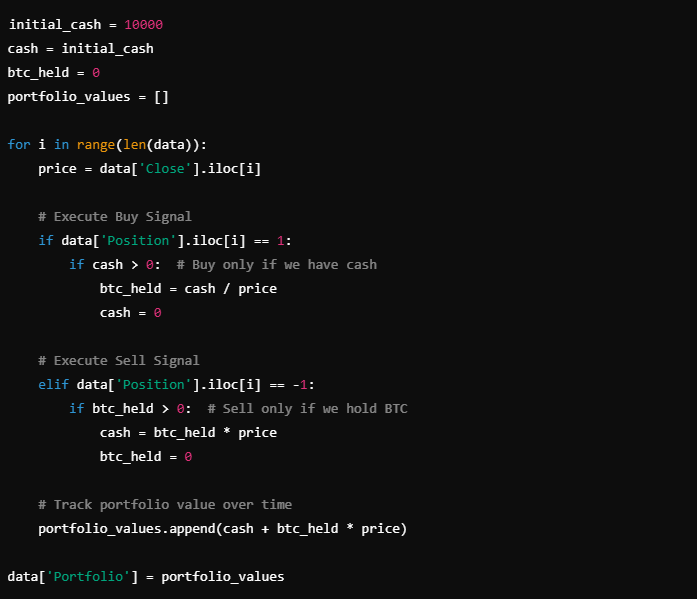
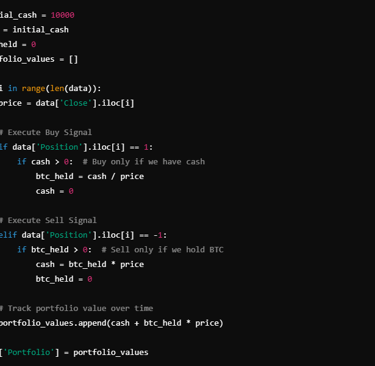
Simulating Trades and Managing a Portfolio
Next, we’ll simulate the trading process. We start with $10,000 and go “all-in” when we receive a buy signal, converting our cash into BTC. When we receive a sell signal, we exit our position, converting BTC back into cash.
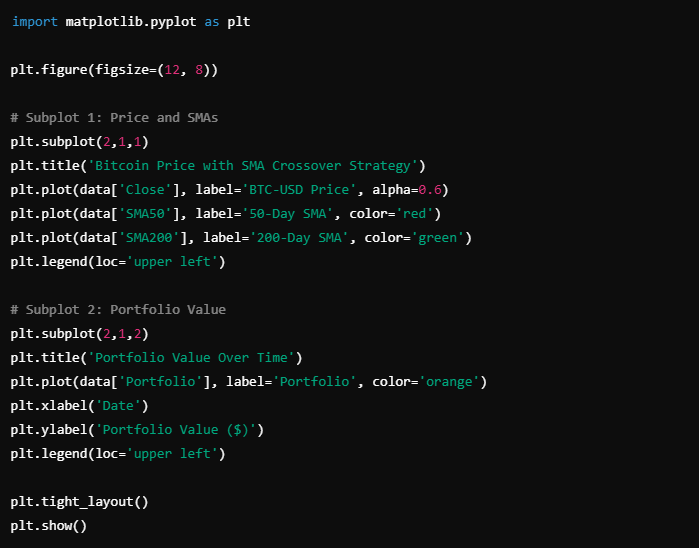
Visualizing Strategy Performance
To better understand performance, we’ll plot the Bitcoin price, moving averages, and the portfolio value over time.
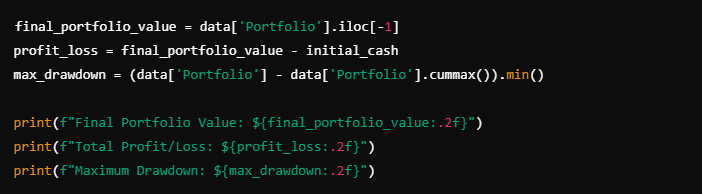
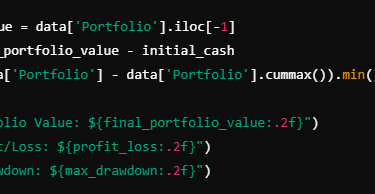
Evaluating Results and Key Metrics
Assessing key performance metrics helps refine your strategy:
Final Portfolio Value: How much is the portfolio worth at the end?
Total Profit/Loss: Difference between final and initial capital.
Maximum Drawdown: Largest peak-to-trough portfolio decline.
Optimizing and Iterating Your Strategy
Backtesting is an iterative process. Consider experimenting with:
Different Timeframes: Test 30-day vs. 100-day SMAs or shorter time intervals.
Additional Indicators: Introduce RSI, MACD, or volume-based indicators.
Risk Management Rules: Add stop-losses, position sizing algorithms, or leverage to mitigate risk.
Constant experimentation, optimization, and analysis are crucial to achieving consistent trading performance.
Conclusion and Next Steps
By learning how to backtest from scratch, you’ve taken a significant step toward becoming a more self-reliant, data-driven trader. With the ability to verify your ideas, refine your parameters, and understand the risk-reward profiles of different approaches, you’re well-positioned to navigate the evolving crypto markets confidently. For more advanced strategies, consider exploring sentiment analysis, machine learning models, or order book dynamics. Keep optimizing, and remember: past performance does not guarantee future results.
The full code is available in our github page.
At NeoQuant, we empower traders and quantitative analysts with cutting-edge resources, tools, and educational materials. If you have a more complex trading strategy and need assistance with backtesting or optimization analysis, feel free to reach out.
Translating your trading ideas into reliable algorithmic systems.
© 2025. All rights reserved.
contact@neoquant.tech
Address: 3 Moskovyan Street, Yerevan, Armenia
Contact Us